HWMO App Help
 to zoom back out to Hawai'i


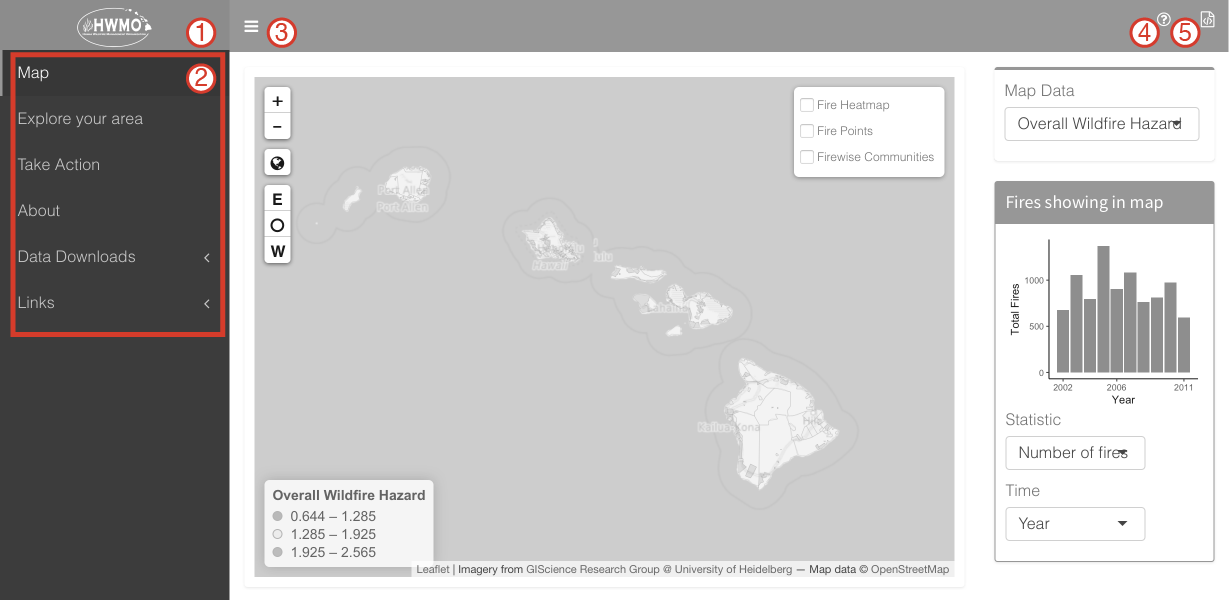
The graph to the right of the map contains all fires in the zone visible in the map window. To see exactly what is measured in the graph, be sure to turn on one of the historical fire overlays.
Notice changing the "Time" X axis from Year to Month allows you to see seasonable patterns. On the other hand, the "Statistic" Y column has options to go from just the number of fires historically in the map area to see their relative destructiveness (fires by average acrage bured)

On this page you can find out hazard information for individual communities. Scroll down or start typing an island to select where you want to learn about. Find your community in the Area drop down list.
Hazard scores are divided into 5 categories:
The take action page provides information about what you can do to increase fire resilience in your community and across Hawai'i. Click on an action item to reveal specific information. Be sure to take a look at our videos and lots of links!
This page also contains links to all our social media sites if you want to connect with us.


Here is where you can look at all the priorities identified in community meetings about wildfire awareness. Pick a focus and a Community Wildfire Protection Plan (CWPP) region to sort the data, then click the download button on the upper right to receive either all or subset you've selected. The download comes in a comma separated values (CSV) format.
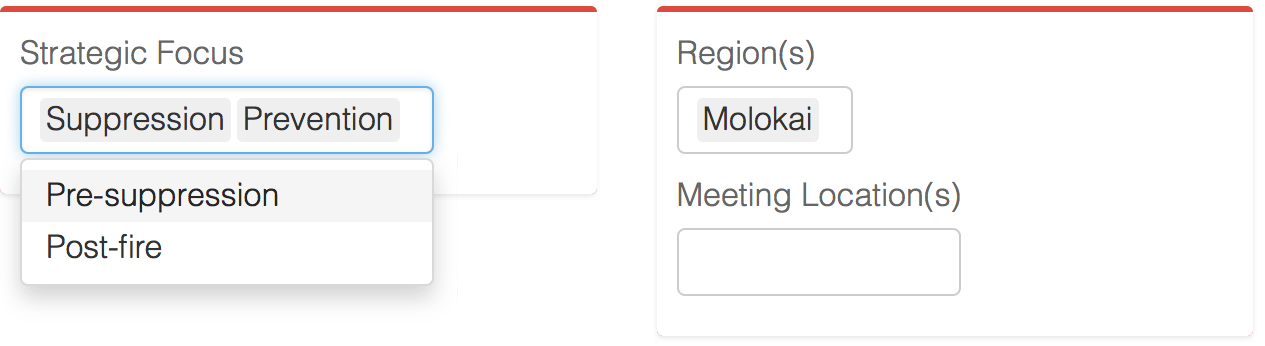 Remember that you can choose more than one region or strategic focus to browse.
This works just like the Community Meeting Info download page except for hazard data. Notice how you can sort the table columns such that you can either look for a specific community alphabetically or organize the table by hazard score. You can also leave the filters blank and search by keyword.

Click on the Links menu item to access links to the HWMO main website and to the code we used to build the app!
return to app